Net4Cities is pleased to announce the public launch of its online dashboard, providing access to environmental monitoring data collected across the project’s network of measurement stations in 13 European cities.
The dashboard offers visitors an opportunity to explore both real-time and historical data generated through Net4Cities‘ extensive monitoring activities. These measurements, focused on “pollutants of emerging concern” such as ultrafine particles (UFP), ammonia, and noise support the project’s goal of improving our understanding of transport-related air and noise pollution and their impacts on urban environments and human health.
The platform has been designed to make project data accessible to a wide audience, including researchers, city representatives, policymakers, environmental professionals, and interested citizens.
Explore monitoring stations across Europe
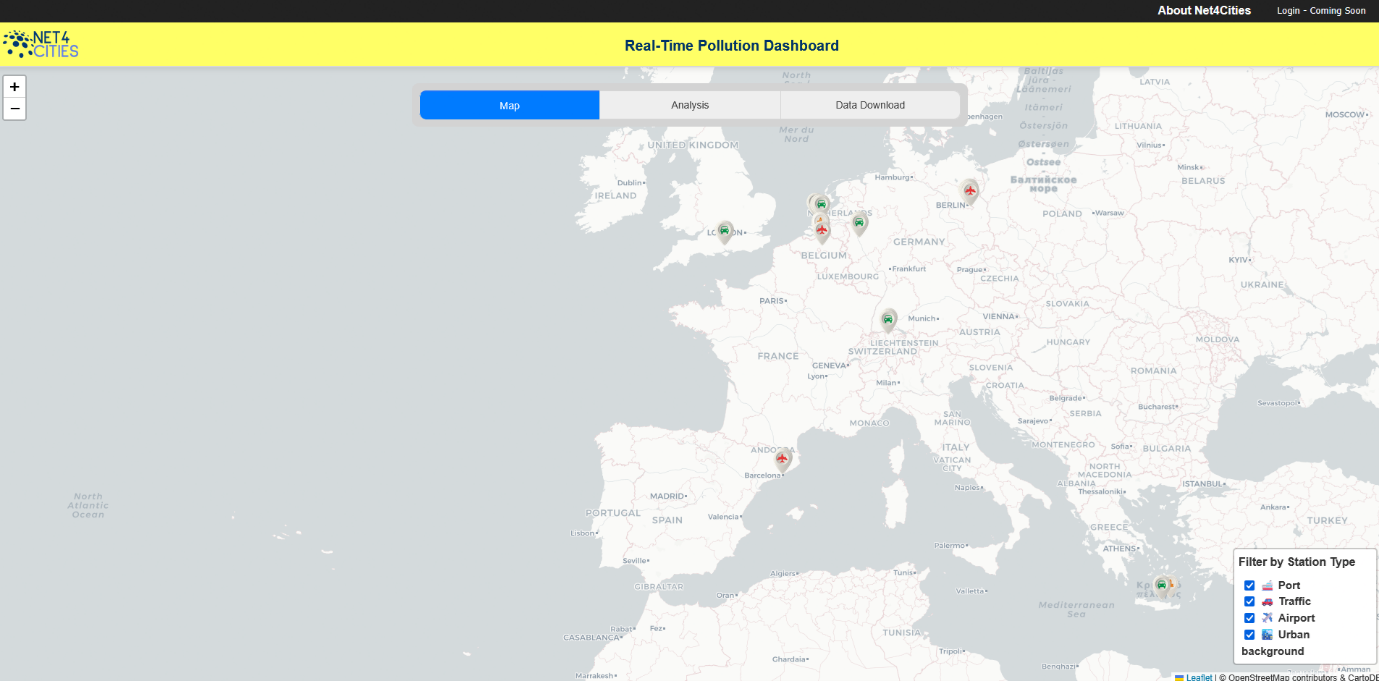
The Map view provides an overview of the Net4Cities monitoring network across 13 European cities. Users can navigate the interactive map to discover monitoring locations and learn more about the different station types included in the project.
Stations can be filtered according to their monitoring environment, including:
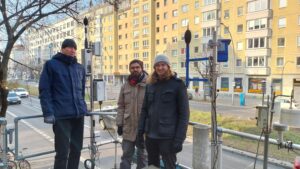
- 🚗 Traffic stations
- ✈️ Airport stations
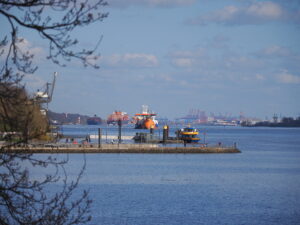
- 🚢 Port stations
- 🏙️ Urban background stations
This allows users to quickly identify and compare different monitoring environments across Europe.
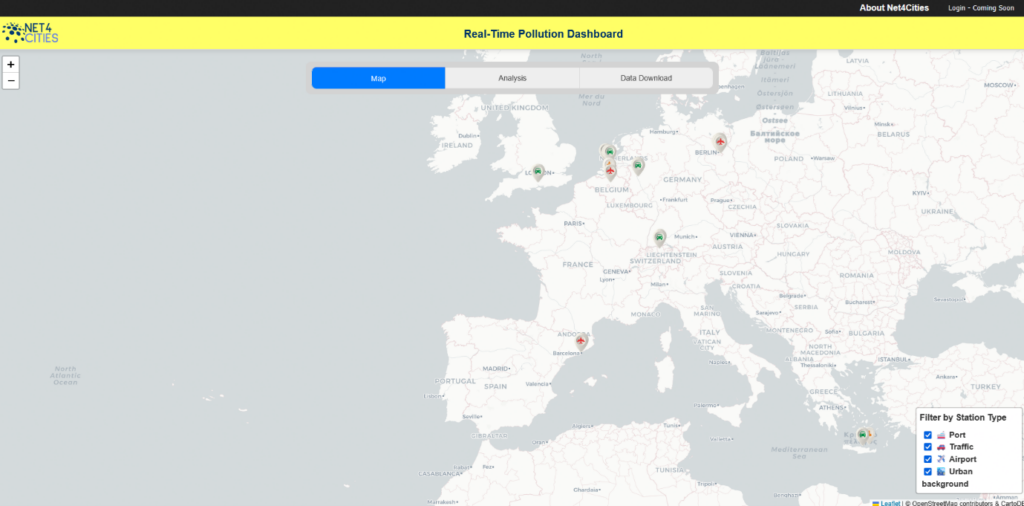
Figure 1. The interactive map displays the Net4Cities monitoring network across Europe. Users can filter stations by monitoring environment, including traffic, airport, port, and urban background locations.
Analyse real-time and historical data
The Analysis tab enables users to explore measurements collected at individual monitoring stations.
Users can:
- Select a specific monitoring station.
- Define a time range for analysis.
- Choose different data aggregation options.
- View current, minimum, maximum, and average values for the monitored parameters.
Based on the selected filters, the dashboard automatically generates a range of visualisations to support data exploration and interpretation.
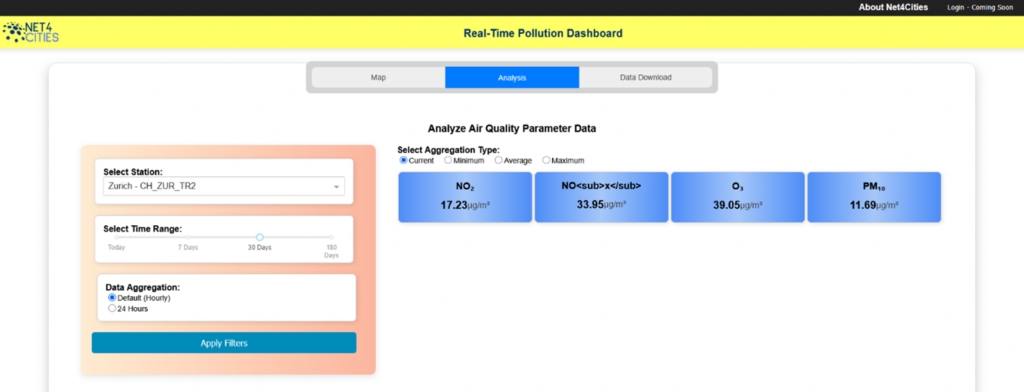
Figure 2. Users can select a station, define a time period, and choose aggregation options to explore current, minimum, maximum, and average values for monitored parameters.
Interactive visualisations
The dashboard currently includes a range of interactive tools designed to support data exploration and interpretation.
📈 Time-series plots show how pollutant concentrations evolve over time, allowing users to identify trends, peaks, and temporal patterns in the measurements.
📊 Statistical visualisations help users better understand the distribution and variability of the data and include:
- Box plots
- Violin plots
- Histograms
All visualisations are fully interactive. By hovering over the plots, users can access detailed information about individual measurements and statistical indicators, making it easy to explore the data in greater depth and gain additional insights into local air quality conditions and pollution dynamics.
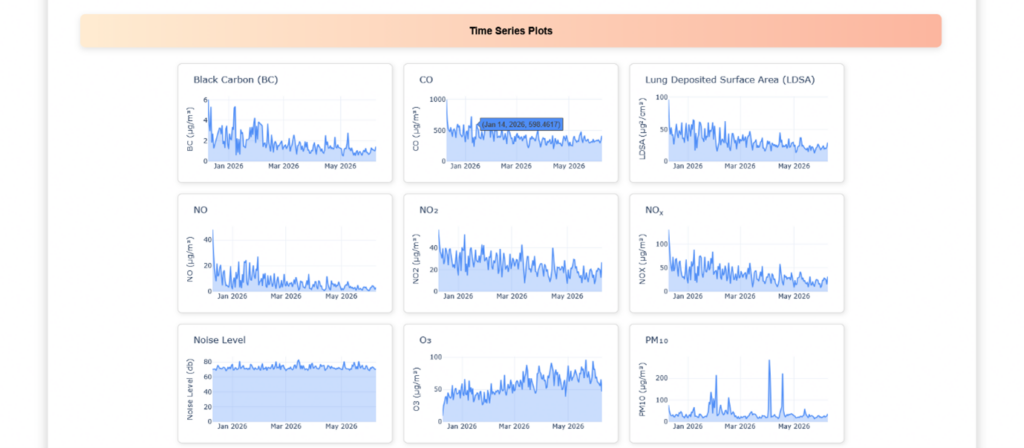
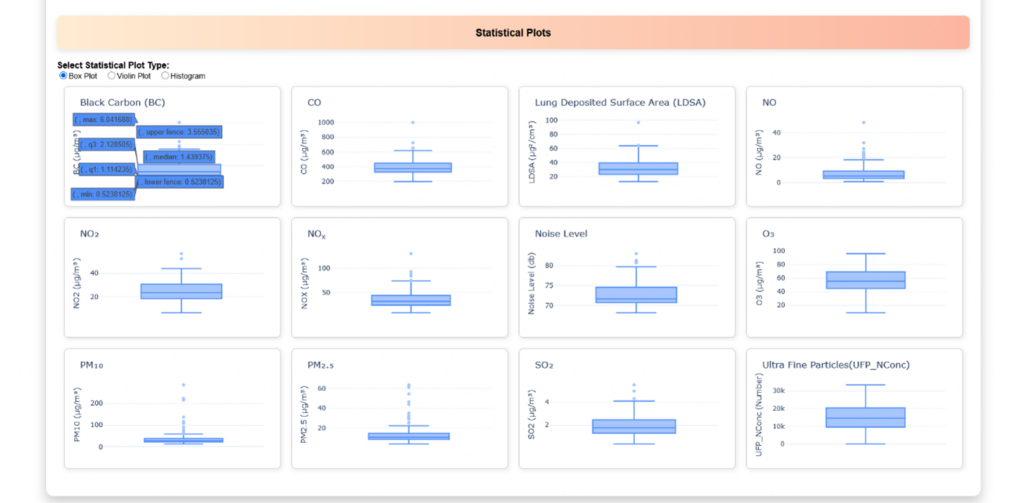
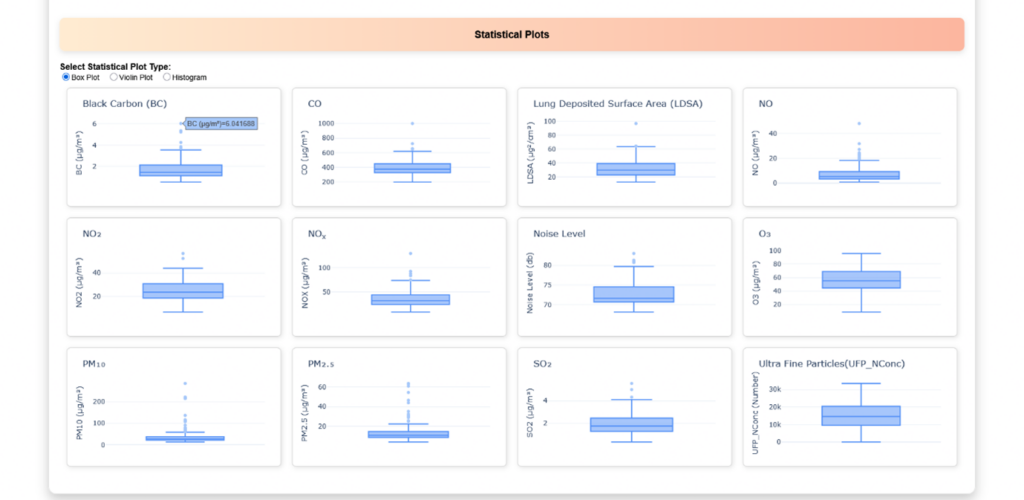
Figure 3. The dashboard automatically generates time-series plots and statistical visualisations based on the selected filters, helping users explore trends and variability in environmental measurements.
A growing European monitoring network
The data displayed on the dashboard originate from Net4Cities monitoring stations located in 13 European cities. The network includes measurements from a variety of urban environments, helping researchers better understand pollution sources, exposure patterns, and the effectiveness of mitigation measures.
As the project continues, the amount of available data will increase, providing an increasingly valuable resource for research, urban planning, and evidence-based policymaking.
Future developments
The current version of the dashboard enables users to visualise and explore data online. Future updates will introduce additional functionalities, including options for downloading datasets and expanded tools for data analysis and interpretation.
Explore the Dashboard
The dashboard is available here:
👉 https://net4cities.eu/dashboard/
We encourage everyone interested in air quality, environmental monitoring, and healthier cities to explore the platform and discover the growing body of data being generated by the Net4Cities project.
Stay Connected
Follow Net4Cities to stay informed about new data releases, project results, webinars, and events:
🌐 Website: https://www.net4cities.eu
📬 Sign up to our Newsletter!
💼 LinkedIn: https://www.linkedin.com/company/net4cities
🦋 Bluesky: https://bsky.app/profile/net4cities.bsky.social